8 · Debugging with DAP
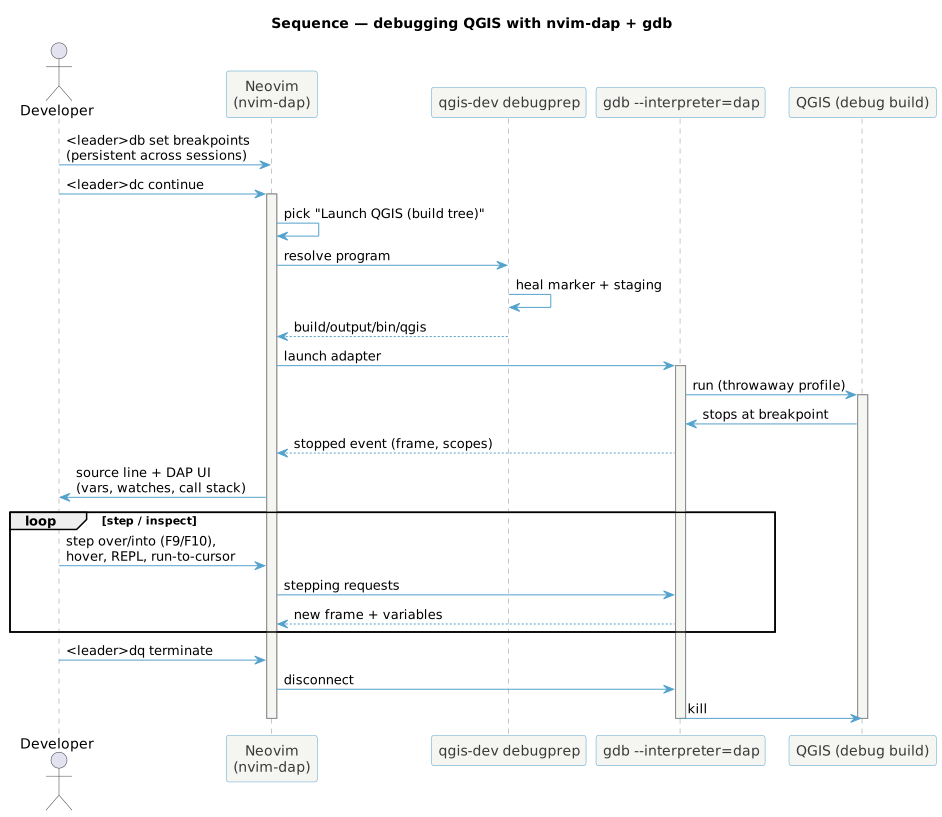
Step through QGIS core in Neovim — breakpoints, variable inspection, the call stack, and attach-to-running — all without leaving the editor. This uses nvim-dap (shipped and configured by nix-vim) driving gdb's native DAP interpreter; the sidecar adds the C++ adapter and the QGIS launch configurations.
Prerequisites (once)
- A Debug build:
qgis-dev profile debug(the default). It compiles with-g -gsplit-dwarfand a gdb index, so the debugger has full symbols and starts fast. Optimised profiles (release) will skip and reorder code — debug there only when chasing an optimisation-specific bug. - A built binary:
qgis-dev build.
No adapter to install — nixpkgs ships gdb 17 with --interpreter=dap,
and the sidecar registers it automatically when you open a .cpp/.h
buffer in the devshell.
Start a session
- Open the source you want to break in, e.g.
nvim src/core/qgsvectorlayer.cpp. - Put the cursor on a line and press ++leader++
dbto toggle a breakpoint (a red marker appears in the sign column). - Press ++leader++
dc(continue). With no session running, nvim-dap asks which configuration to launch — choose “Launch QGIS (build tree)”. - Behind the scenes
qgis-dev debugprepheals the build-tree marker and Python staging, then hands gdb the binary. QGIS starts with a throwaway profile; when execution reaches your line it stops and Neovim jumps to it.
One-key equivalents
nix-vim maps F-keys too: F8 toggle breakpoint, F5 continue, F9 step over, F10 step into, F12 run to cursor, Shift+F5 terminate, Shift+F9 toggle the DAP UI.
Step through
| Key | Action |
|---|---|
++leader++ dc / F5 |
Continue to the next breakpoint |
++leader++ dv / F9 |
Step over the current line |
++leader++ dn / F10 |
Step into a call |
++leader++ do |
Step out |
++leader++ dt / F12 |
Run to cursor |
++leader++ dR |
Restart the session |
++leader++ dq / Shift+F5 |
Terminate |
Inspect state
- ++leader++
du(Shift+F9) toggles the DAP UI — a sidebar with Scopes (locals/arguments, expandable — Qt containers likeQString,QList,QMapdisplay their contents thanks toset print pretty on), the call stack (click a frame to jump), watches, and breakpoints. - ++leader++
dhshows a hover with the value of the symbol under the cursor. - ++leader++
dropens the REPL — type gdb/expression commands, e.g.layer->name()orp *this, evaluated in the current frame. - Add a watch from the DAP UI’s Watches pane (or
:lua
  require('dapui').elements.watches.add('expr')
).
Breakpoints that survive restarts
Breakpoints are persistent across sessions — nix-vim saves them under
stdpath("data")/breakpoints and reloads them when you reopen a file, so
your carefully placed traps are still there tomorrow. No action needed.
Two richer kinds:
- ++leader++
dB— conditional breakpoint (prompts for an expression; breaks only when true, e.g.id == 42). - ++leader++
dL— log point (prints a message instead of stopping —printf-debugging without recompiling). - Shift+F8 — clear all breakpoints.
Attach to a running QGIS
Already have QGIS open (say it hangs, or you reached a hard-to-script UI
state)? Press ++leader++ dc, choose “Attach to running QGIS”, and
pick the process from the list (pre-filtered to qgis). gdb attaches to
the live process with full symbols; set breakpoints and continue.
Debugging PyQGIS
The DAP configs above debug the C++ side. To step through Python
plugin/console code, use nix-vim’s Python debugger entry (++leader++ da,
which attaches debugpy) against a QGIS started with the Python debugger
enabled. Mixed C++/Python stepping isn’t automatic — debug one layer at a
time.
Troubleshooting
- “no built binary” — run
qgis-dev buildfirst. - No variables /
<optimized out>— you’re on an optimised profile; switch withqgis-dev profile debugand rebuild. - Adapter not offered — you’re outside the devshell (no
gdbon PATH) or not in acpp/cbuffer.direnv allow, reopen. - perf-style permission errors on attach — see the kernel setting note.
That completes the developer journey — you can now build, run, test, pre-commit, and step through QGIS core entirely from the editor.