Build profiles & flags
A profile is a committed set of CMake arguments (profiles/*.profile).
Switch with qgis-dev profile <name> or <leader>px; the active profile
is stored per-worktree in .dev-env/profile and reconfigures on switch.
| Profile | Build type | Feature set | Use for |
|---|---|---|---|
debug (default) |
Debug | Everything on (3D, PDAL, WebEngine, tests) | Everyday development and debugging |
minimal |
Debug | 3D/PDAL/WebEngine/tests/bindings off | Fastest core-C++ iteration (not PyQGIS work) |
release |
RelWithDebInfo | Everything on | Profiling and performance work — Debug timings mislead |
asan-ubsan |
Debug + sanitizers | 3D/PDAL/WebEngine off | Memory and UB bug hunts (qgis-dev qa asan) |
All profiles share: Ninja, ccache compiler launchers, the (wrapped) mold
linker, compile_commands.json export, and (Debug) split dwarf +
gdb-index for fast links and fast debugger startup. Debug-config profiles
also pass -UGDAL_DEBUG (see
Troubleshooting for why). ccache objects are
namespaced per profile, so switching never poisons the cache.
Tweaking individual flags
Interactive: <leader>pk lists the current WITH_* / ENABLE_* /
BUILD_* cache values — booleans toggle in one keypress, strings prompt
for a value, and the tree reconfigures.
Terminal:
Overrides live in build/CMakeCache.txt and survive rebuilds; switching
profile resets to that profile's declared set.
Where the time goes
Every build appends to ~/.local/state/qgis-dev-env/build-log.tsv:
timestamp  host  worktree  branch  profile  targets  jobs  duration_s
ccache_hit_pct  result  ccache_hits  ccache_misses
The hit rate and the raw hit/miss counts are per build (counter deltas around each ninja run), not lifetime averages — so builds of different sizes compare honestly.
Analysing your build history
Three views, increasing in polish, all reading the same log:
| Command | Output |
|---|---|
qgis-dev stats [N] (<leader>pG) |
Terminal table of the last N builds + a unicode sparkline + avg/min/max — the quick glance |
qgis-dev stats --graph |
build-times.svg, a single duration line chart |
qgis-dev report [--pdf\|--svg\|--png] [--open] (<leader>pR) |
A branded multi-panel infographic (below) |
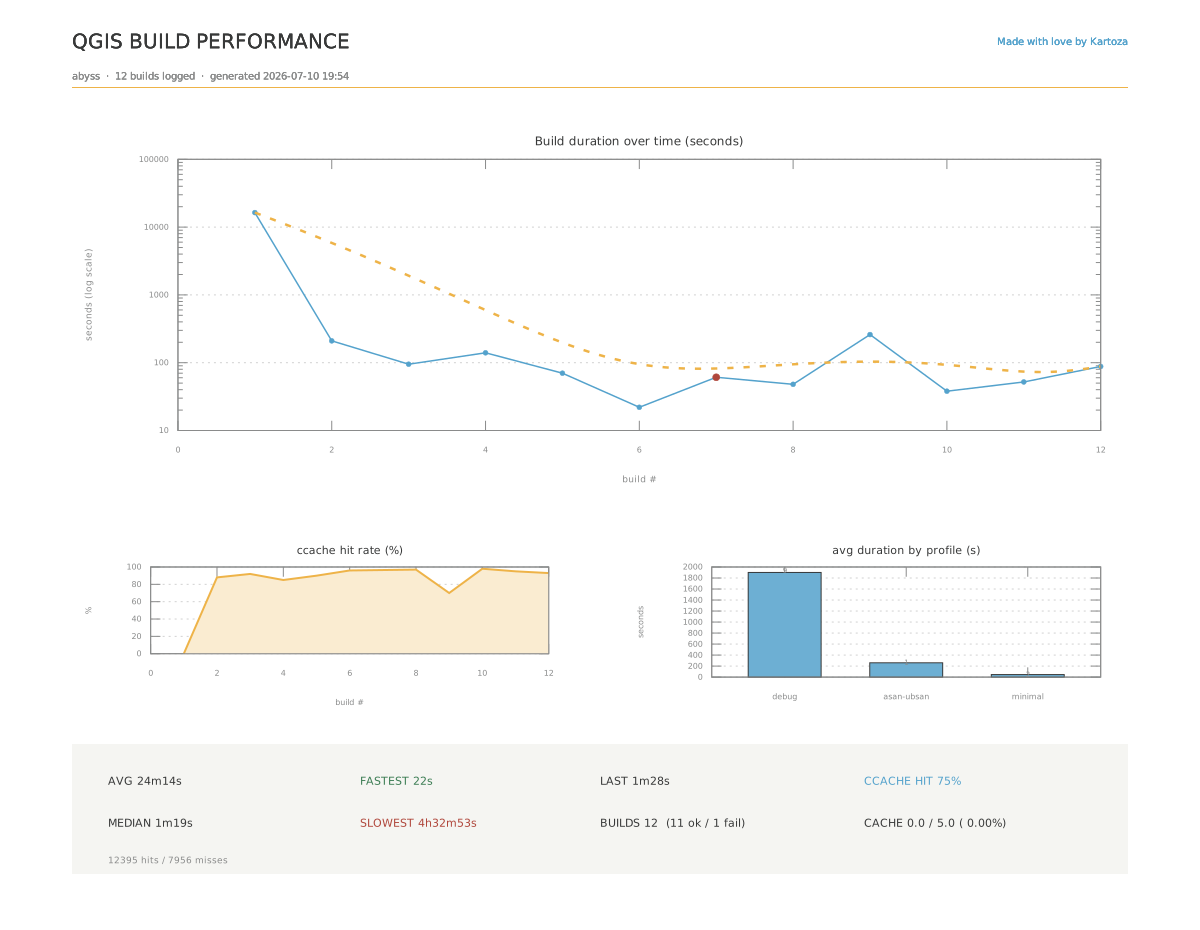
qgis-dev report renders a Kartoza-styled dashboard to
$XDG_STATE_HOME/qgis-dev-env/build-report.<ext> (PDF by default;
--open launches your viewer). It has four zones:
- Duration over time — every build as a line + point; failed builds marked in red; an amber bezier trend line. The y-axis auto-switches to log scale when a cold build would otherwise flatten the incrementals, so seconds-scale rebuilds stay legible next to a multi-hour first build.
- ccache hit rate — the percentage per build, filled area.
- Average duration by profile — bars for debug / minimal / release / asan-ubsan, annotated with build counts, so you can see what each profile actually costs you.
- Summary band — average, median, fastest, slowest and last build times; total builds with ok/fail split; overall ccache hit rate, cache size, and cumulative hits/misses.
The same command is nix run .#report from any terminal. Because the log
is machine-global ($XDG_STATE_HOME/qgis-dev-env/build-log.tsv), the
report spans every checkout and worktree on the machine — compare
profiles, branches and hardware with real numbers instead of vibes.
Roll your own
The log is plain TSV with a header row (see the schema above) — load
it into datamash, a notebook, or a spreadsheet for any analysis the
built-in report doesn't cover.